Query Monitor: The Ultimate Debugging Tool for WordPress Developers •
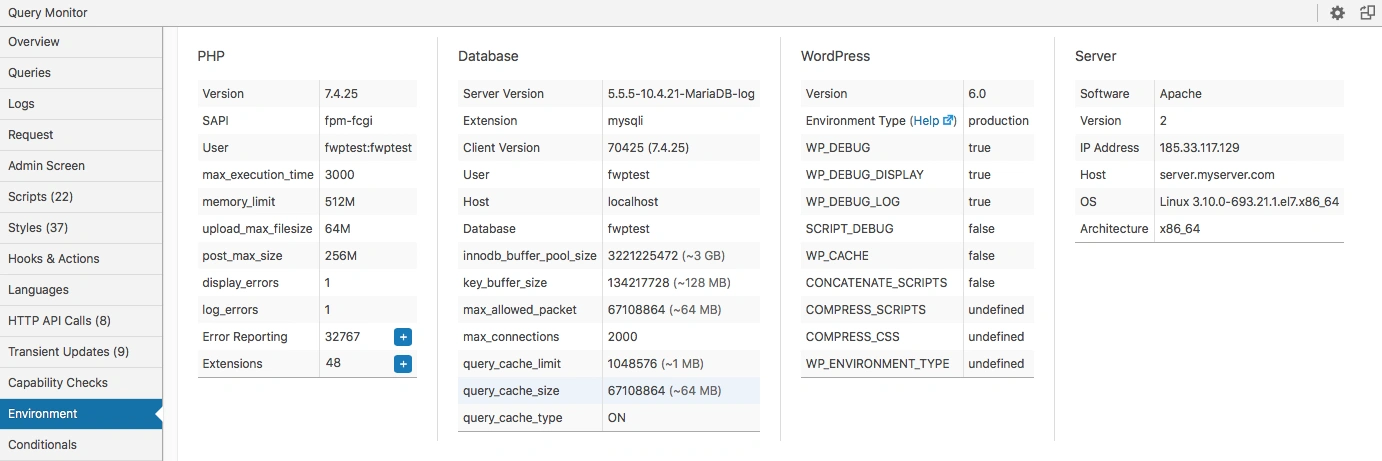
Query Monitor is one of the most powerful and comprehensive debugging plugins available for WordPress developers. It provides in-depth insights into database queries, PHP errors, HTTP requests, and various other performance metrics that can help diagnose issues within a WordPress site. Unlike many other debugging tools, Query Monitor offers real-time monitoring without significantly impacting site performance, making it a go-to solution for developers who need detailed insights into their WordPress environment.
Key Features
- Database Query Analysis
One of the standout features of Query Monitor is its ability to track and display all database queries executed on a page. Developers can analyze queries by component (theme, plugins, or core), view slow queries, and identify inefficient database calls that may be causing performance issues. - PHP Errors and Warnings
Query Monitor detects PHP errors, warnings, and notices, categorizing them for easy debugging. This feature is particularly useful for developers working with custom themes and plugins, as it allows them to identify and fix issues before they become major problems. - HTTP Requests
With Query Monitor, developers can inspect all HTTP requests made by the site, including API calls, AJAX requests, and external resources. This helps in debugging slow or failing requests that could affect website functionality. - Hooks and Actions
The plugin provides visibility into the execution order of WordPress hooks and actions, making it easier to troubleshoot issues related to filters and actions in themes and plugins. - Enqueued Scripts and Styles
Developers can monitor all enqueued scripts and styles, checking for conflicts, unnecessary assets, and dependencies. This is particularly useful for optimizing frontend performance. - Theme and Plugin Debugging
Query Monitor identifies which theme and plugins are responsible for specific database queries, scripts, and errors. This allows developers to pinpoint problematic plugins or themes that may be affecting performance or causing issues. - User Role-Specific Debugging
Unlike many other debugging tools, Query Monitor supports debugging based on user roles. This means developers can see how a page loads differently for an administrator versus a regular visitor, providing valuable insights for role-based functionality. - Multisite Compatibility
For developers managing WordPress Multisite networks, Query Monitor provides dedicated support for tracking queries and performance across different sites within the network.
Why Use Query Monitor?
- Performance Optimization
By identifying slow queries, redundant scripts, and inefficient database calls, Query Monitor helps developers optimize their WordPress sites for better speed and performance. - Debugging Made Easy
Instead of manually inspecting log files or enabling error reporting in WordPress, Query Monitor provides an intuitive interface that categorizes issues in real-time. - Plugin and Theme Development
For developers creating custom themes and plugins, Query Monitor is an invaluable tool for testing and debugging code, ensuring that their work is optimized and free from critical issues. - Security and Stability
By detecting unexpected database queries and HTTP requests, Query Monitor can also help identify potential security threats or stability issues before they escalate.
Query Monitor is readily available in the WordPress Plugin Repository or can be accessed directly through the provided link.
Query Monitor is an essential plugin for any WordPress developer looking to enhance their debugging workflow. With its comprehensive set of features, real-time insights, and performance monitoring capabilities, it provides an unparalleled level of control and visibility over the inner workings of a WordPress site. Whether you’re troubleshooting a slow website, debugging a custom theme, or optimizing plugin performance, Query Monitor is the tool you need in your arsenal.
Discover More